


by Alen Hadzic
In clinical trial enrollment, one of the most important metrics to be able to forecast is the Cost Per Enrollment (CPE)- yet it is surprisingly one of the least understood.
Cost Per Enrollment represents the total cost required to obtain the interest of, and enroll, a single participant into a clinical trial. At a basic level, it is calculated by dividing the cost of generating qualified patient interest by the probability that those interested patients successfully progress through each stage of a typical patient journey funnel.
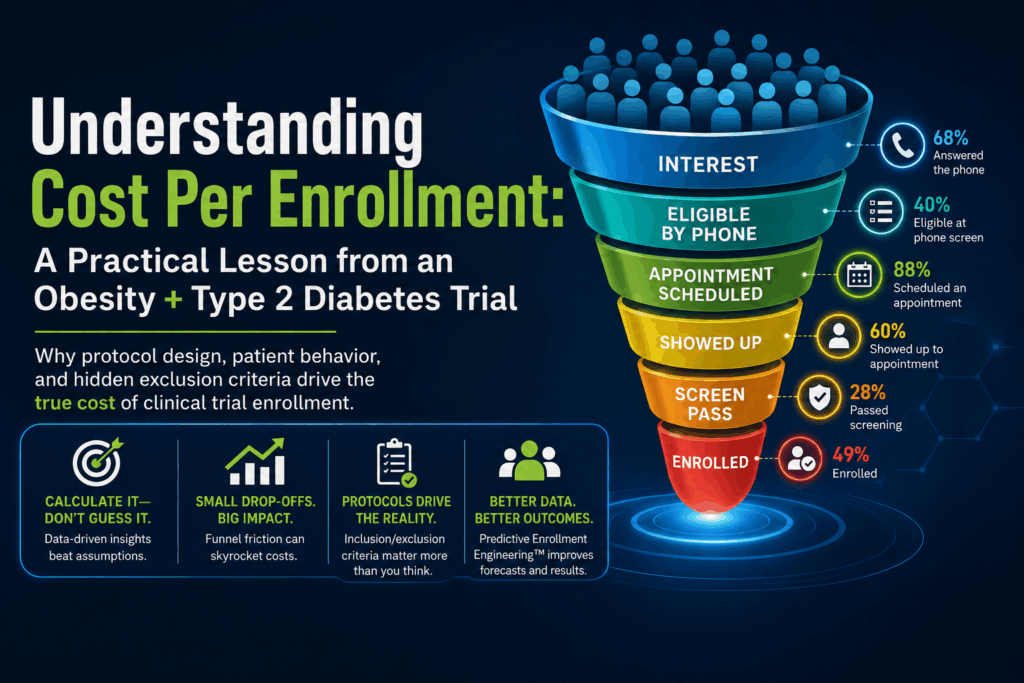
Those steps typically include things like the percentage of patients who answer the phone, the percentage deemed eligible during phone screening, the percentage who schedule an appointment, the percentage who show up, the percentage confirmed by the site as eligible to screen, the screen pass rate, and finally the percentage of patients who choose to enroll after passing screening.
Because each stage reduces the number of patients who move forward, small changes in those probabilities can dramatically affect the final cost of enrolling a single participant.
Despite how important this metric is, Cost Per Enrollment (CPE) is often treated like a rough estimate. Teams guess a number based on past experience, industry averages, or optimistic assumptions about patient interest. But in reality, enrollment economics are rarely that simple.
Every study has its own patient journey, and every protocol introduces its own friction points that dramatically change the cost of bringing a patient from initial interest to full enrollment, oftentimes rendering historical performance tied to a previous study unusable as a metric for determining or forecasting success.
Recently, I analyzed a Phase 3 clinical trial for adults with obesity or overweight and type 2 diabetes. At first glance, the estimated cost per enrollment came out to approximately $2,200 per patient, which initially seemed surprisingly high for a study targeting such a common condition.
Obesity and type 2 diabetes represent massive patient populations in the United States and globally, so one might expect enrollment to be relatively straightforward.
However, once I carefully reviewed the protocol and mapped the patient journey through the enrollment funnel, the reason for the higher enrollment cost became obvious. This experience reinforced an important principle: Cost Per Enrollment should never be guessed- it should be calculated.
Cost per enrollment is the result of two fundamental components. The first is the cost required to generate qualified patient interest. The second is the probability that an interested patient successfully progresses through each step of the recruitment funnel.
Mathematically, the relationship can be expressed simply. Cost Per Enrollment equals Cost Per Qualified Interest divided by the product of funnel conversion probabilities. Those funnel probabilities represent the real-world steps patients must complete between first hearing about a trial and ultimately enrolling in it.
In this particular study, the funnel probabilities looked roughly like this:
Each step removes a portion of the potential participants. When those probabilities are multiplied together, the effective conversion rate from initial qualified interest to enrolled patient becomes quite small. That small conversion rate drives the overall cost per enrollment upward.
This particular trial investigates once-weekly injections to reduce body weight in adults with obesity or overweight who also have type 2 diabetes. Participants must be at least 18 years old, have a BMI greater than 27 kg/m², and have had a diagnosis of type 2 diabetes for at least six months.
At first glance, this sounds like an enormous target population. Millions of individuals meet those general criteria. But once the exclusion criteria are considered, the addressable population shrinks significantly.
Patients who previously underwent surgical treatments for obesity are excluded from participation. In real-world populations, many individuals with severe obesity eventually explore surgical options such as gastric banding or other bariatric procedures. Eliminating this group removes a meaningful segment of highly motivated candidates.
Participants who previously received device-based obesity therapies are also excluded unless the intervention occurred long before screening. Technologies such as intragastric balloons and other device-based interventions have become increasingly common in obesity treatment. As these therapies grow in popularity, this exclusion criterion removes a growing portion of otherwise interested patients.
Another important restriction involves diabetes treatment stability. Participants must have been on a stable diabetes treatment regimen for at least ninety days before screening. In the real world, diabetes medications are frequently adjusted by physicians in response to glucose levels. As a result, many patients who might otherwise qualify fail this requirement simply because their treatment plan changed recently.
The protocol also requires stable body weight during the ninety days before screening, defined as less than a five percent change in body weight. Ironically, individuals who are actively trying to lose weight (often the most motivated candidates for participation) are also the most likely to experience weight fluctuations and therefore fail this criterion.
Participants must also meet specific glycemic control thresholds. For example, patients must have an HbA1c level of ten percent or lower at screening. While medically reasonable, this requirement excludes individuals with poorly controlled diabetes who may otherwise be interested in participating.
Finally, an additional major enrollment constraint comes from the widespread use of GLP-1 medications and other pharmacologic weight-loss medications.
In today’s treatment landscape, drugs such as semaglutide, liraglutide, and tirzepatide are increasingly prescribed for both obesity and type 2 diabetes.
However, trials evaluating a new weight-loss therapy must avoid confounding effects from other medications that could independently influence body weight. As a result, participants who are currently taking, or who have recently taken, weight-management medications are often excluded or fail treatment stability requirements prior to screening.
In practice, this removes a large segment of the modern obesity population from eligibility. Many otherwise motivated participants responding to recruitment campaigns ultimately fail phone screening or site screening simply because they are already receiving one of these therapies.
When recruitment begins, the top of the funnel often looks extremely promising. Digital advertising campaigns may generate thousands of interested patients, especially for conditions as common as obesity and diabetes.
But as potential participants move through the funnel- phone screening, eligibility confirmation, appointment scheduling, site evaluation, and formal screening- the number of viable candidates declines sharply.
In this study, the most dramatic narrowing occurred during screening. Only twenty-eight percent of screened participants are estimated to pass screening. That single statistic dramatically increases recruitment cost because the system must process many more leads to produce each enrolled patient. More leads require more advertising spend, more screening calls, and more operational effort.
For clinical research sites, this analysis highlights an important operational lesson. Before activating a study, it is critical to understand the recruitment implications of the protocol.
Sites should evaluate:
If these factors are not understood early, sites risk underestimating the difficulty of the study and overcommitting to enrollment timelines.
The analytical framework used to evaluate this study falls under a new methodology called “Predictive Enrollment Engineering.”
Rather than relying on assumptions, Predictive Enrollment Engineering breaks the enrollment process into measurable stages and models the probability that patients will progress through each stage. By combining those probabilities with the cost of generating patient interest, it becomes possible to forecast enrollment performance before recruitment even begins.
This allows sponsors and sites to answer a fundamental question: what advertising budget is required to enroll a specific number of patients?
When that question can be answered with data rather than guesswork, enrollment planning becomes significantly more reliable.
Ultimately, the most important variable in calculating Cost Per Enrollment is understanding where patient interest originates. Digital advertising provides something the industry historically lacked: a real-time, algorithmically generated Cost Per Lead.
Because campaigns can be launched, paused, adjusted, and relaunched at any moment, digital channels reflect patient interest as it exists right now, not as it existed months or years ago in historical enrollment reports.
While historical data can provide useful benchmarks, there is no more immediate or accurate indicator of actual patient demand for a study than measuring response to digital outreach in real time.
This is why the recruitment funnel and its conversion probabilities are only part of the equation. Equally important is the source of the original patient interest. When interest is generated through scalable digital channels with measurable Cost Per Lead, it becomes possible to combine that metric with funnel conversion probabilities and calculate Cost Per Enrollment with a level of precision that was previously impossible in clinical trial enrollment.
Obesity and type 2 diabetes are among the most common chronic conditions in the world. On paper, a study targeting this population might appear easy to recruit for- but protocols do not operate on paper.
Every inclusion requirement, exclusion criterion, and screening procedure shapes the enrollment funnel. The lesson from this study is simple: Cost Per Enrollment is not a guess. It is the result of protocol design interacting with real patient behavior.
Alen is the Founder and CEO of Clinical Trial Scan (CT SCAN), a company focused on transforming how clinical trial enrollment is planned, forecasted, and executed. His work centers on treating patient enrollment not as a reactive process, but as a system that can be modeled, predicted, and optimized before a study begins.
Alen studied at Columbia University, where he focused on Financial Economics and Pre-Medical Studies, and later attended Vlerick Business School, a top-ranked program for innovation and entrepreneurship, where he completed a Master’s in Innovation, Management, and Entrepreneurship.
He is the creator of Predictive Enrollment Engineering™, a patent-pending methodology powered by DYNO Ai™, which uses probabilistic funnel modeling, behavioral response data, and operational constraints to forecast cost per enrollment, timelines, and execution risk. This approach enables sponsors, CROs, and research sites to make informed decisions about feasibility and budget allocation prior to recruitment, rather than adjusting after delays occur.
A defining influence on Alen’s approach comes from his years in consulting, where he worked across a wide range of industries analyzing how businesses operate, scale, and fail. His experience spans call center operations, medical device and pharmaceutical product rollouts, pricing strategy, and retail execution. This work required a consistent focus on dissecting systems, identifying bottlenecks, and understanding how operational and behavioral variables drive outcomes.
Through that lens, he developed a fundamentally different perspective on clinical research. While much of the industry approaches enrollment as a logistical or awareness challenge, Alen identified it as a structural and system-level failure. This outside-in viewpoint led him to focus on what he believes is the industry’s most critical issue: the absence of a predictive, engineered approach to patient enrollment.
Prior to CT SCAN, he also led performance-driven digital advertising and patient acquisition initiatives, where he developed a deep understanding of how platform algorithms, audience behavior, and distribution mechanics determine whether patients ever encounter a study in the first place. This reinforced a key insight that underpins his work: recruitment success is governed as much by exposure and delivery systems as it is by messaging.
In addition to CT SCAN, Alen is the Founder of iSOCRa (International School of Clinical Research Advertising), where he trains clinical research professionals and organizations to better understand digital visibility, patient acquisition, and strategic positioning within a competitive research landscape.
Earlier in his career, he supported clinical research operations directly, including patient interaction and data collection, providing firsthand insight into how participation decisions are made. Combined with his background in consulting and systems modeling, this shaped his view that clinical trial enrollment is not a logistical challenge, but a measurable system with predictable outputs when properly engineered.
His work is driven by a single principle: enrollment should be known in advance, not discovered after timelines slip.